Video Tutorial:
What is htop?
In the intricate landscape of server management, a reliable tool to monitor and control processes is rather useful. Enter htop—an interactive process viewer for Unix systems that goes beyond the traditional top command. It provides a dynamic and user-friendly interface, allowing you to navigate through processes effortlessly. But why should you care about htop, especially when dealing with a Virtual Private Server (VPS)?
Why Use htop on a VPS?
Managing a VPS involves juggling numerous tasks, from resource allocation to troubleshooting performance issues. htop becomes an invaluable ally in this scenario, offering real-time insights into your server’s processes, resource usage, and overall performance. Unlike its predecessor, top, htop presents information in a more visually appealing and comprehensible manner, making it an indispensable tool for both beginners and seasoned sysadmins.
In the following sections, we will have a close look at the functionalities of htop and guide you through its practical usage on a VPS, empowering you to take control of your server environment with confidence.
Installing htop
Managing your VPS efficiently begins with getting htop up and running. Here is how you can install it on Debian-Based Linux distributions.
Checking if htop is already installed
To check if htop is already installed on your system, open a terminal and simply type:
htopIf htop is installed, the application will launch, and you are good to go. If not, you will need to proceed with the installation steps below.
Installing htop on Debian-Based Linux Distributions
For Debian and its derivatives like Ubuntu, the installation process is straightforward. Open a terminal and use the apt package manager to install htop:
sudo apt update sudo apt install htop The first command updates the package lists to ensure you have the latest information about available packages. The second command installs htop on your system.
Once the installation is complete, you can run htop by typing `htop` in the terminal. Now, with htop at your fingertips, you are ready to start getting detailed insights into the intricate details of your VPS’s processes and resource usage.
Getting Started with htop
Let us explore how to effectively use this powerful tool:
Launching htop
To launch htop, open a terminal and simply type:
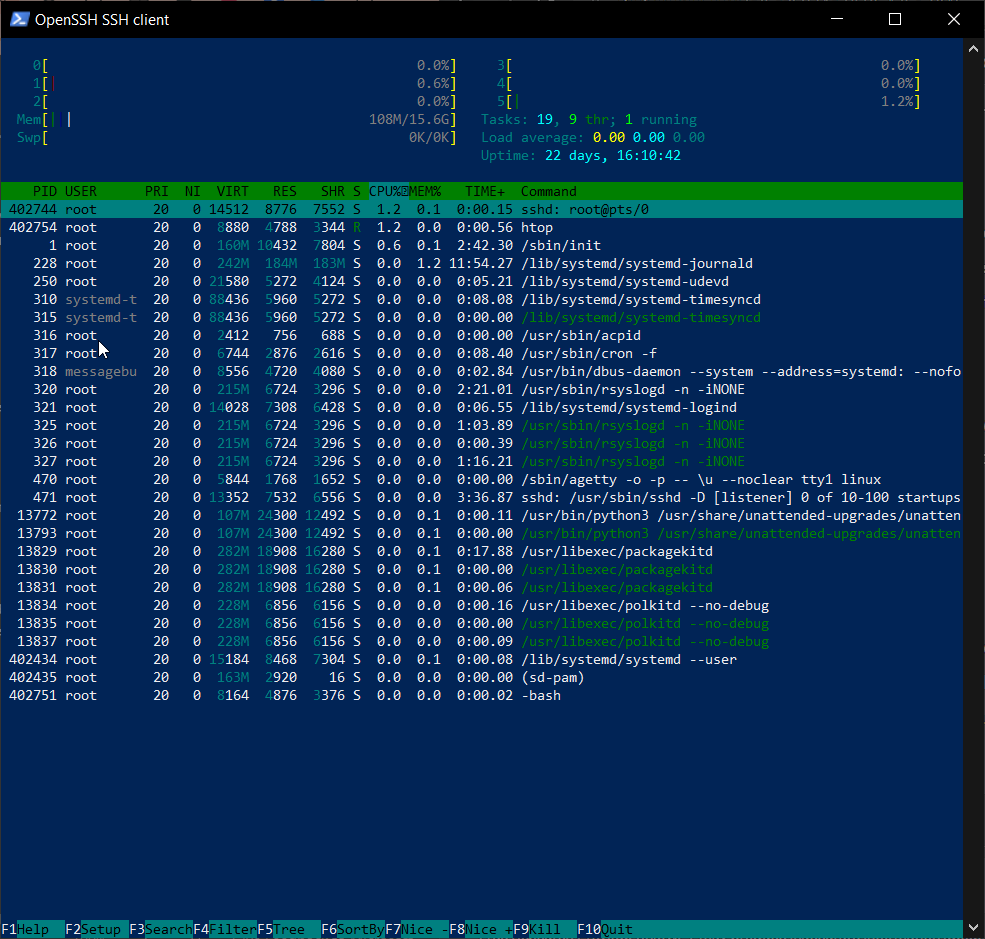
htop The htop interface will spring to life, presenting you with a real-time view of your system’s processes.
Understanding the htop Interface
Overview of the Processes List
At the heart of htop lies the processes list. Here, you will find a dynamic display of all the processes running on your VPS.
Key Information Displayed
htop provides a wealth of information about each process, from its PID (Process ID) to its CPU and memory usage.
Navigating Through htop
Navigating htop is possible using the arrow keys to move up and down the process list. To sort the list based on specific criteria, such as CPU usage or memory consumption, use the F keys (F1, F2, etc.) corresponding to the desired sorting option.
Sorting and Filtering Processes
htop allows you to sort and filter processes on the fly. Pressing F6 brings up a menu where you can choose the sorting method. Want to focus on processes owned by a specific user? Press F4, and you can filter the list accordingly.
These features make htop a rather flexible tool, enabling you to tailor the display to your specific needs at any given moment.
Armed with these basics, you are now equipped to navigate the htop interface and gain insights into your VPS’s performance. In the next section, we will look at the htop advanced features, making it possible for you to harness its full potential.
Interpreting htop Metrics
Understanding the metrics htop presents is important for making informed decisions about your VPS’s performance, so here is an abbreviated htop metrics glossary
CPU Usage
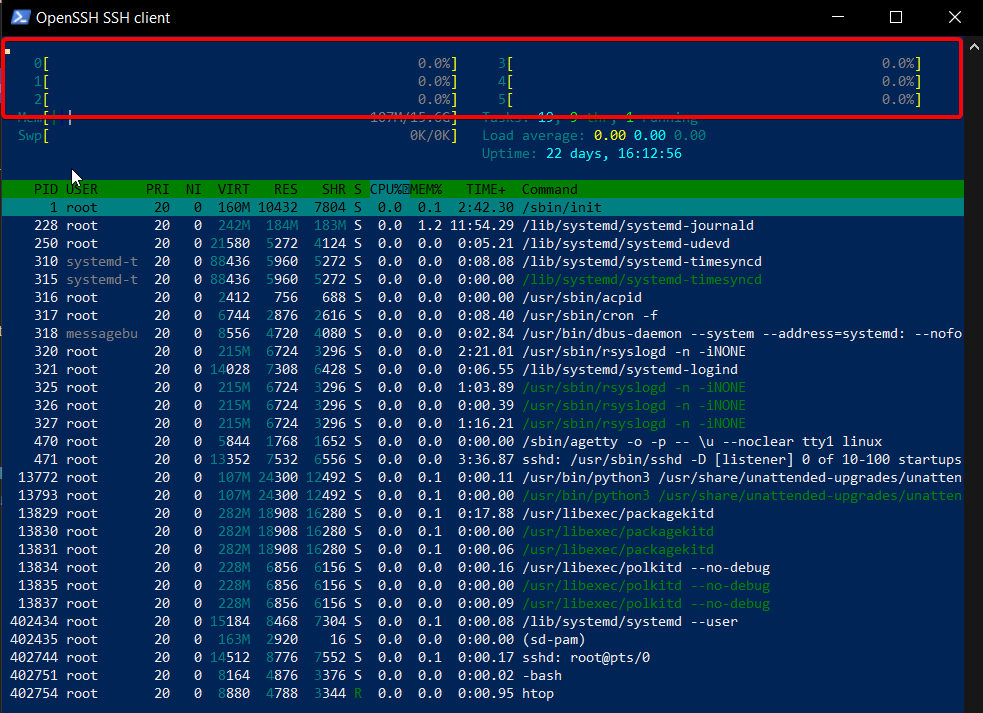
At the top of the htop interface, you will find a real-time display of CPU usage. This metric illustrates the percentage of CPU resources being utilized. High CPU usage may indicate that your server is working hard, potentially nearing its capacity.
Memory Usage
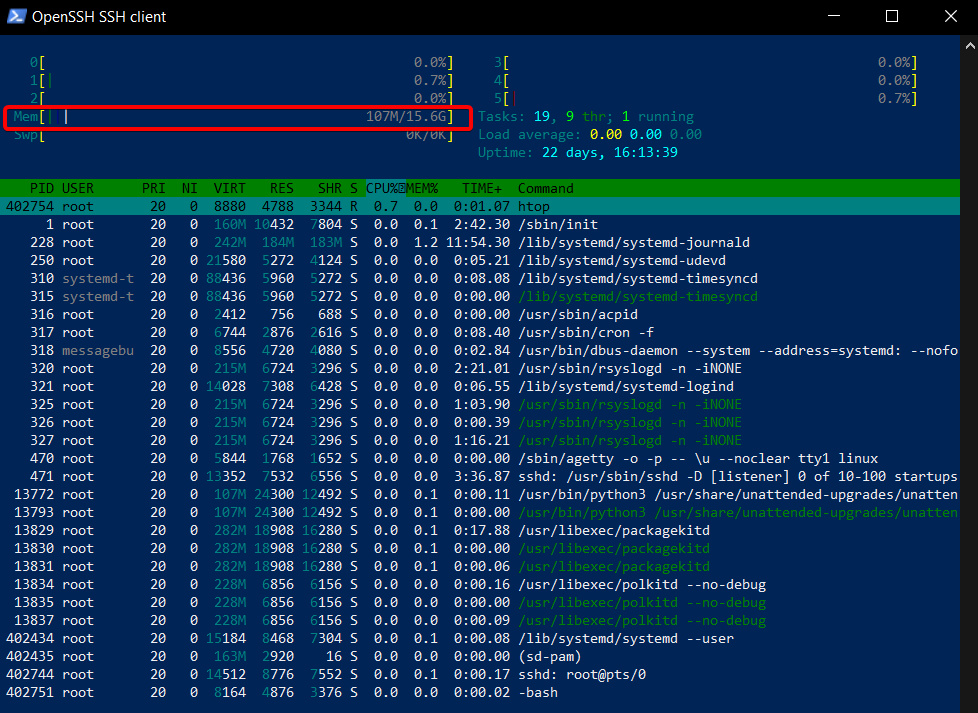
Near the CPU usage, the memory bar provides insights into RAM utilization. If the bar is filled, it suggests that a significant portion of your available memory is in use.
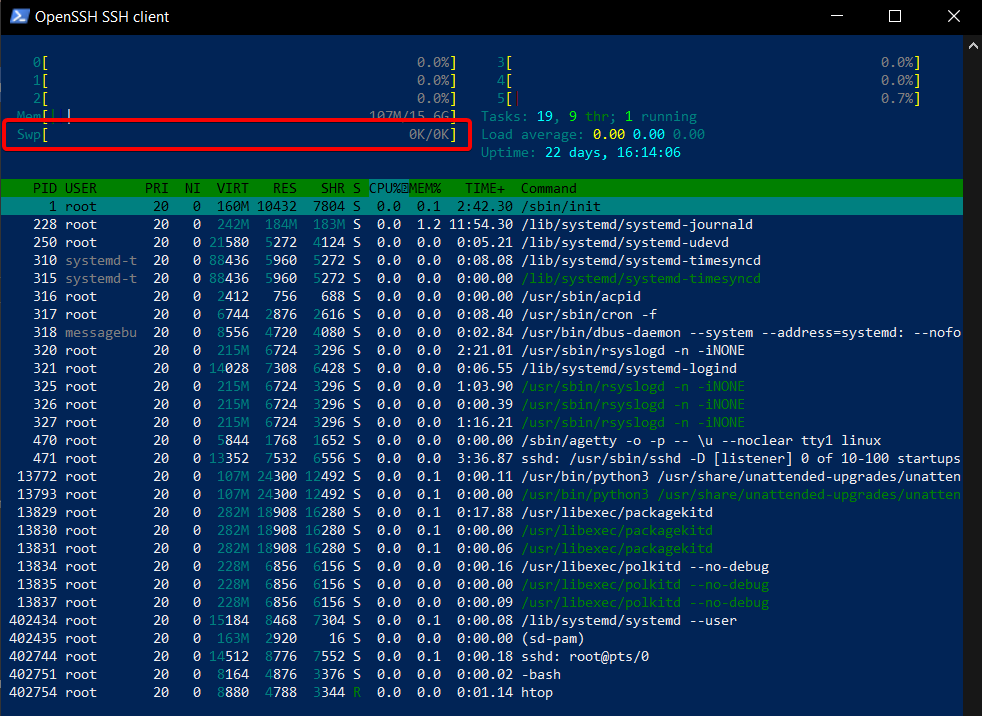
Swap Usage
The swap bar, if visible, represents the usage of swap space—a portion of your disk used as virtual memory when physical RAM is exhausted. Excessive swap usage may indicate that your server is running out of available memory.
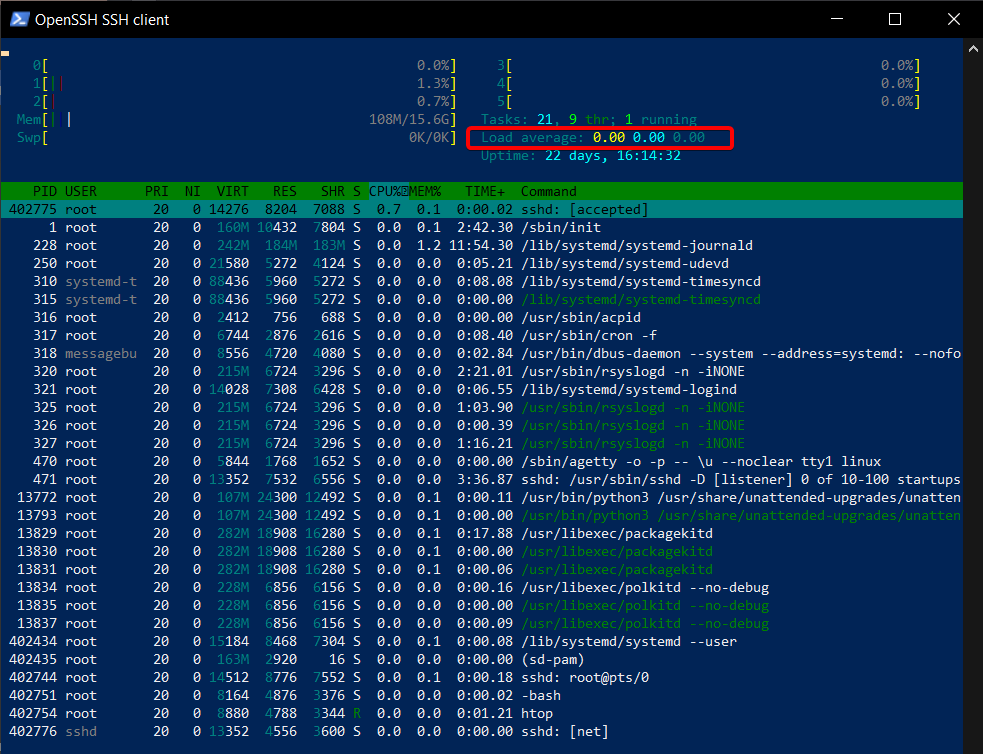
Load Average
htop displays the load average at the top right corner, indicating the average system load over different time intervals. A load average close to the number of CPU cores is considered acceptable. Spikes or consistently high values may indicate a resource bottleneck.
Process Details
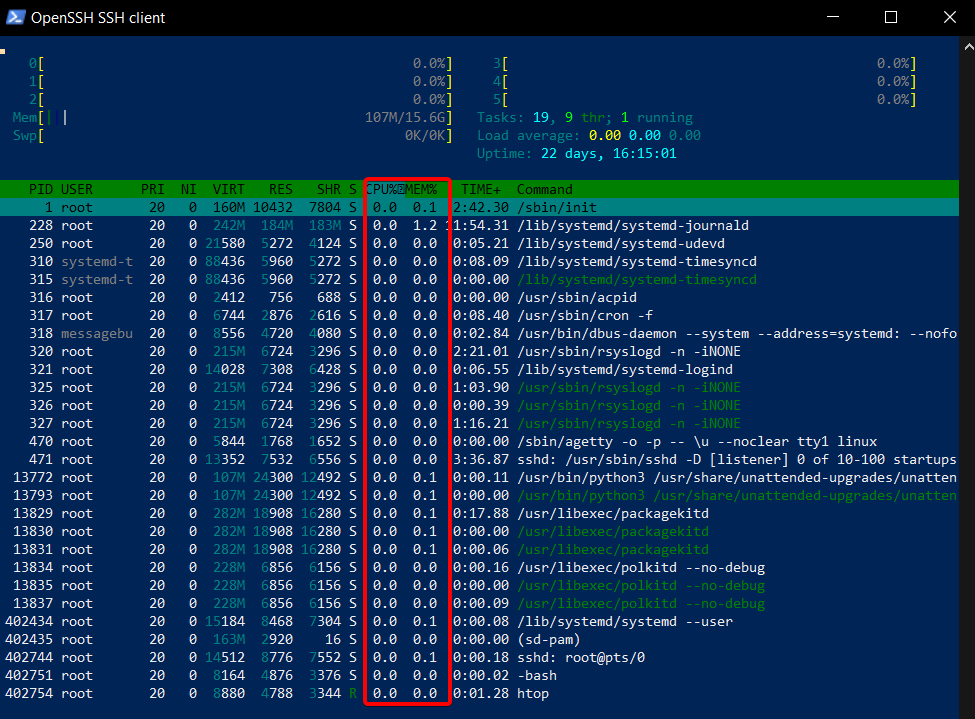
CPU and Memory Usage per Process
The main section of htop provides a detailed list of processes, including their individual CPU and memory usage. This granular data allows you to identify resource-hungry processes that might be affecting your VPS’s performance.
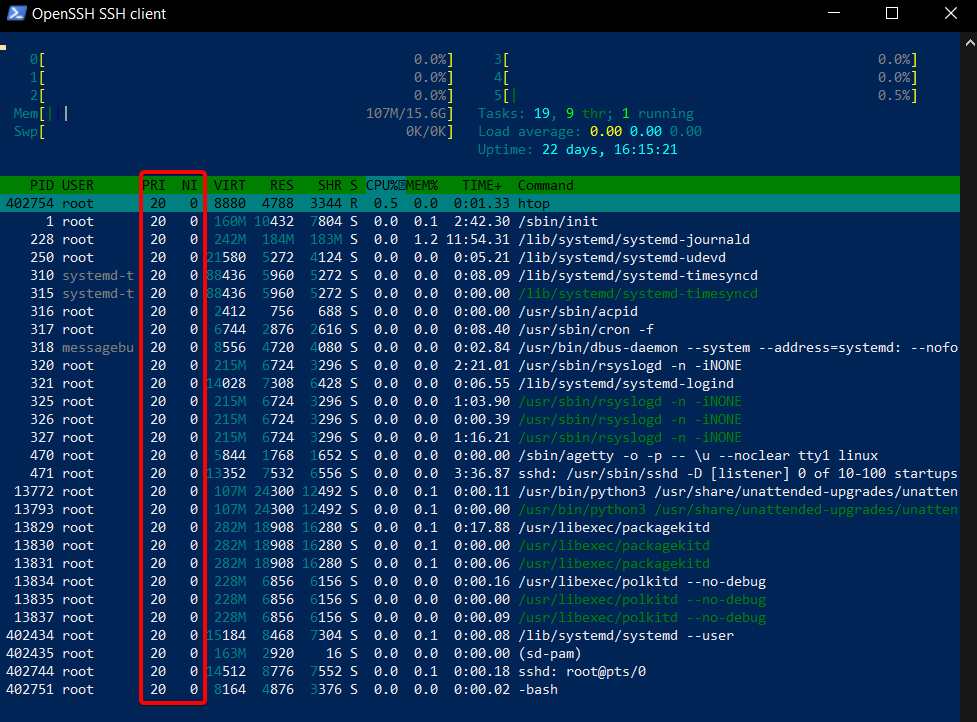
Process Priority and Nice Values
Assign a priority value and a ‘nice’ value to each process. Consequently, the priority determines a process’s importance, influencing the amount of CPU time it receives. Additionally, the ‘nice’ value further impacts the priority, where higher values indicate lower priority. Understanding these values can help you identify and manage critical processes effectively.
Armed with the ability to interpret these metrics, you gain a holistic view of your VPS’s performance. In the next section, we will explore how to use this information to optimize resource allocation and troubleshoot potential issues.
Interacting with Processes
Beyond monitoring, htop empowers you to take control of your VPS by providing tools to manage processes efficiently. Moreover, it offers a user-friendly interface for seamless navigation and optimization.
Killing Processes
Inevitably, there will be times when you need to terminate a misbehaving process. To do this in htop, simply navigate to the process you want to end with the arrow keys, select it, and press the ‘F9’ key. Confirm the action by pressing [Enter], and htop will send the termination signal, gracefully ending the process.
Renicing Processes
Renicing involves changing the priority of a process after it has started. As you navigate to the desired process using the arrow keys, press ‘F7’ to decrease priority (make it more favorable) or ‘F8’ to increase priority (make it less favorable). This is particularly useful for fine-tuning resource allocation.
Renaming Processes
htop allows you to customize the way processes are displayed. As you navigate to the process using the arrow keys, press ‘F2,’ and you can change its name. This feature is handy for differentiating between multiple instances of the same application or giving a more descriptive label to a process
Changing Process Priority
In addition to renicing, you can directly change a process’s priority. With the arrow keys, select the process, and press ‘F7’ or ‘F8’ to adjust the nice value. Lower values give the process higher priority, while higher values decrease priority.
By mastering these interactions, you gain a level of control over your VPS that goes beyond mere observation. htop transforms into a dynamic tool for actively managing and optimizing your server’s performance. In the next section, we will explore more advanced features that further enhance your ability to fine-tune and troubleshoot your VPS environment.
Customizing htop
Tailoring htop to suit your preferences and workflow can significantly enhance your VPS management experience. Let us explore the various customization options available.
Changing the htop Display Options
Changing the Color Scheme
htop offers flexibility in color schemes, allowing you to choose one that aligns with your visual preferences. Press ‘F2’ to access the setup menu, navigate to “Colors,” and explore the available options. Whether you prefer a classic scheme or a more vibrant look, htop accommodates your style.
This is an example of the color scheme “Black night”:
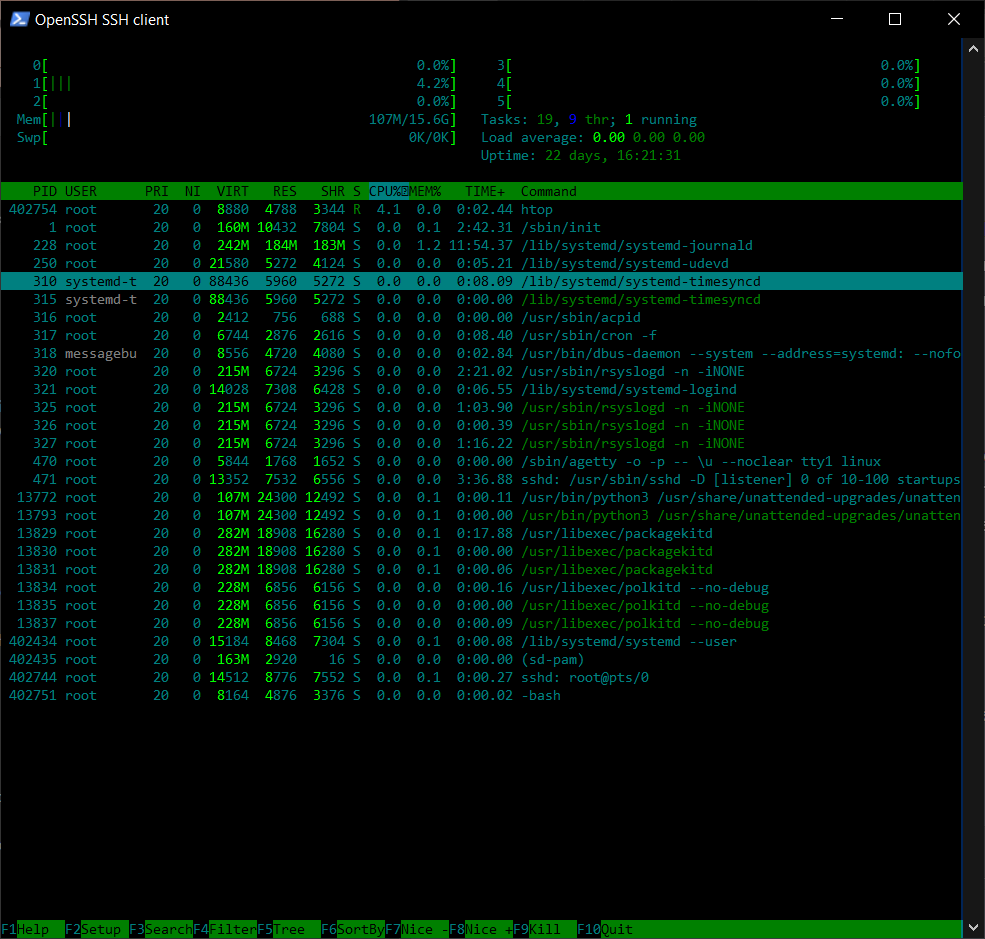
Pretty nice, right?
Customizing Column Order and Visibility
Tailor the information in the processes list to prioritize the details that matter most to you. Transition to the next step by pressing ‘F2’ to access the setup menu. Navigate to “Columns,” where you can reorder or toggle the visibility of columns. This customization ensures that the crucial metrics are readily available immediately.
Customizing htop not only enhances its aesthetic appeal but also streamlines your workflow, allowing you to focus on the specific metrics and details that matter most to your VPS management tasks.
Benefits of Using htop on a VPS
In essence, htop is more than just a process viewer; it is a dynamic and indispensable tool for effectively managing Virtual Private Servers (VPS). From providing real-time insights into CPU and memory usage to interactive processes management and customizable displays, htop empowers users to navigate, troubleshoot, and optimize their VPS environments with precision. Whether you are a seasoned sysadmin or a VPS enthusiast, htop stands as a versatile companion, offering a comprehensive solution for monitoring, interacting, and customizing the server management experience.
